
- Stakeholder: Zephyr Healthcare Solutions - Medicare Analytics Dashboard
- Business Case: As the developer of the Medicare Analytics Dashboard for Zephyr Healthcare Solutions, our objective is to provide an educational and insightful platform for Zephyr’s team and stakeholders to explore and analyze Medicare charges data for the year 2021.
Project Details
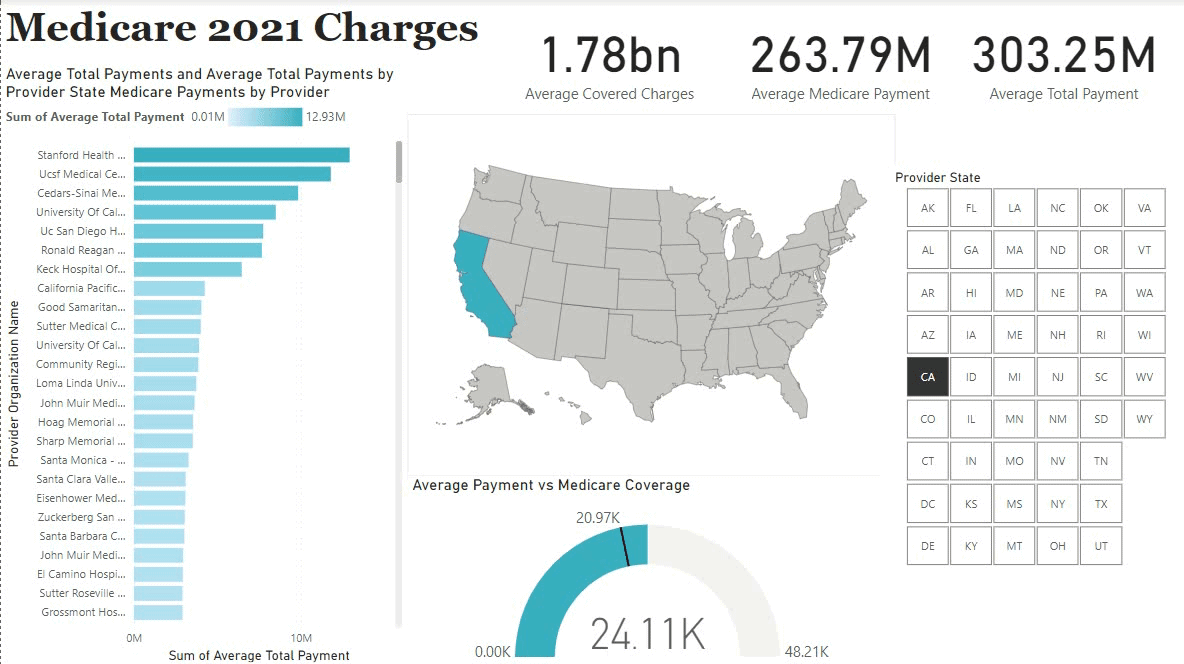
This project aims to create an informative dashboard that allows Zephyr Healthcare Solutions to gain insights into Medicare charges across various regions and healthcare providers. The dashboard is hosted on Power BI.
Project Requirements
Data Collection and Preparation
- Obtain Medicare charges data for the year 2021 from reliable sources, ensuring data accuracy and completeness.
- Perform data cleaning and preprocessing to handle any inconsistencies or missing values.
- Document the data collection and preparation process to maintain transparency.
Dashboard Development
- Create an interactive Power BI dashboard that allows Zephyr’s team to explore Medicare charges by region, provider, and other relevant dimensions.
- Implement visualizations, charts, and tables to effectively communicate key insights.
- Ensure the dashboard is user-friendly and provides a seamless experience for Zephyr’s team.
Data Analysis
- Analyze trends and patterns in Medicare charges for different healthcare services and regions.
- Provide comparative analyses to highlight variations and outliers.
- Generate summary statistics and visual representations of the data.
User Support
- Offer guidance and support to Zephyr’s team on how to navigate and interpret the dashboard.
- Address inquiries and provide assistance as needed.
Privacy and Compliance
- Adhere to privacy regulations and data protection policies while handling sensitive Medicare data.
- Ensure the confidentiality of individuals and healthcare providers involved in the dataset.
- Clearly communicate any limitations or ethical considerations associated with the analysis.
Documentation
- Provide comprehensive documentation explaining the data sources, methodology, and analytical techniques used in the dashboard.
- Maintain well-organized code and data repositories for easy replication and further development.
Reproducibility and Accessibility
- Structure the project to allow for easy replication of the analysis and verification of results.
- Include clear instructions on how to access and utilize the dashboard.
- Ensure that the dashboard and its contents are accessible to Zephyr’s team and stakeholders.
Collaboration and Feedback
- Welcome contributions and feedback from Zephyr’s team to enhance the dashboard’s functionality and insights.
- Provide guidelines and instructions for collaborative contributions.
- Engage with Zephyr’s team, address their feedback, and consider their input to improve the dashboard’s usability and value.
By adhering to these project requirements, the Medicare Analytics Dashboard for Zephyr Healthcare Solutions aims to be an invaluable educational tool, fostering data-driven insights for Zephyr’s team and stakeholders interested in understanding Medicare charges for the year 2021.